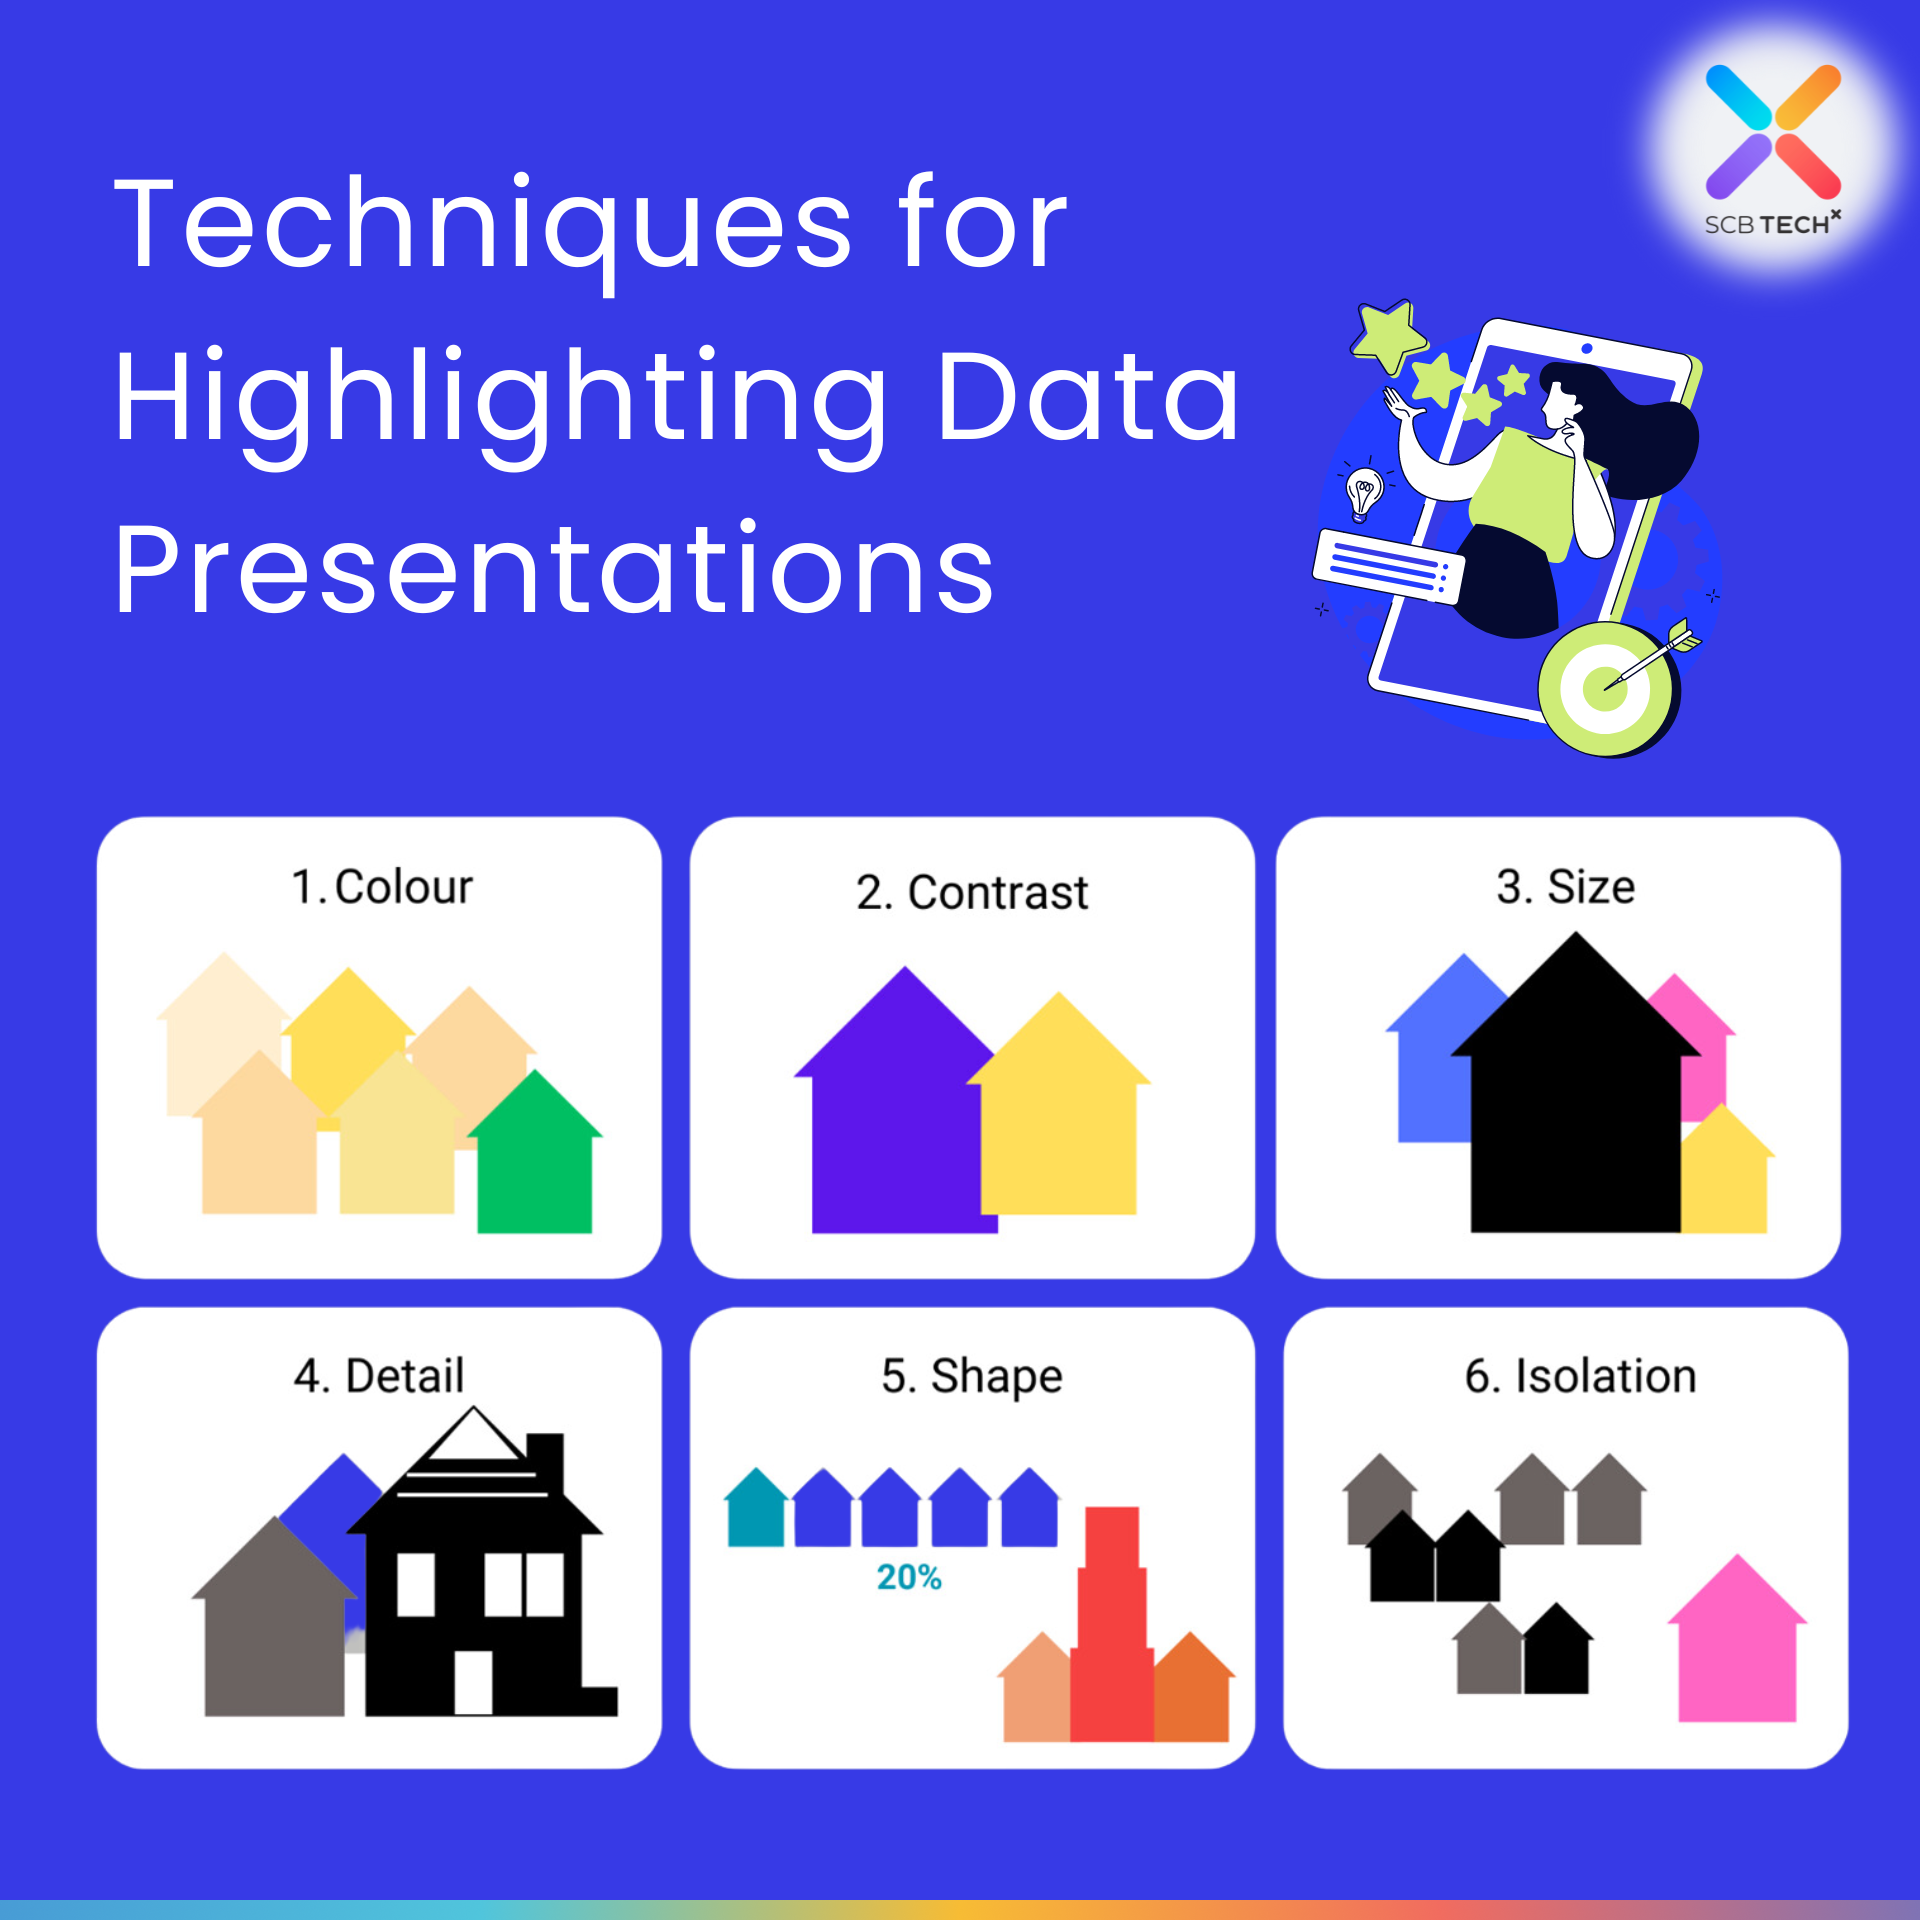
Currently, utilizing Visualization to present business data through BI Tools and Presentations is highly popular. Today, we invite Khun Rubina Rattanaruangsup, Data Science Business Analyst from SCB TechX, to share 6 simple yet effective techniques for emphasizing data through Visualization 📊:
- Color: Choose vibrant colors to highlight key data, instantly attracting attention.
- Contrast: Use two contrasting colors, with one emphasizing the focal data and the other for everything else.
- Size: Enlarge or emphasize the focal data to draw viewers’ attention effectively.
- Detail: Adding details to the focal data helps in efficient communication.
- Shape: Adjusting the shape of emphasized data aids better focus and quicker memorization.
- Isolation: Separating the emphasized data helps direct viewers’ focus directly.

These techniques enhance the memorability of vital information for viewers and make presentations easier for presenters. Feel free to try them out!
📌 Lastly, SCB TechX is ready to provide any organization with professional advice, technology solutions, and comprehensive Data Platform services through TechX Data Platform.
If you are interested, please feel free to contact us at ▶️ contact@scbtechx.io
Or visit us for more details at ▶️ https://bit.ly/3QjtHgl


