How We Solved API Rate Limit Challenges with Grafana Alloy

ไทย

generated by AI

In our journey to build a robust monitoring system for our mysql instances on Azure, we encountered a significant challenge: Azure API rate limits. This blog post details how we leveraged Grafana Alloy with Azure Exporter to architect a more efficient monitoring solution.

The Challenge: Azure API Rate Limits


Our infrastructure includes more than 20 mysql instances on Azure, each requiring monitoring for multiple metrics:

  • CPU utilization
  • Memory usage
  • Disk space
  • Query performance
  • Connection count


Initially, we used Grafana’s Azure Monitor datasource for alerting. However, we quickly discovered a critical limitation: the inability to use regex patterns for Azure Monitor alert rules. This meant we had to create individual alert rules for each MySQL instance and each metric:

  • 1 alert rule for mysql-a memory utilization warning
  • 1 alert rule for mysql-a memory utilization critical
  • 1 alert rule for mysql-a cpu utilization warning
  • 1 alert rule for mysql-a cpu utilization critical
  • 1 alert rule for mysql-b memory utilization warning
    ..and so on


With 20+ mysql instances and 10+ metrics per instance, we were creating hundreds of alert rules. Each rule generated separate API calls to Azure Monitor, rapidly consuming our API quota and occasionally triggering rate limits. This resulted in:

  • Delayed or missed alerts
  • Inconsistent monitoring coverage
  • Increasing operational overhead


What is Grafana Alloy?

Grafana Alloy is an open-source distribution of the OpenTelemetry Collector, designed to simplify and enhance observability by integrating various telemetry formats such as metrics, logs, traces, and profiles into a unified platform. It supports both OpenTelemetry and Prometheus pipelines, making it a versatile tool for managing complex observability needs in modern cloud-native environments

grafana.com

Our Solution: Grafana Alloy with Azure Exporter

After evaluating several options, we implemented a more scalable architecture using:

  • Azure Exporter – A lightweight agent that collects metrics from Azure Monitor API
  • Grafana Alloy  – A metrics gateway to transform and route telemetry data
  • Grafana Mimir – A highly scalable metrics storage backend

The Implementation Process


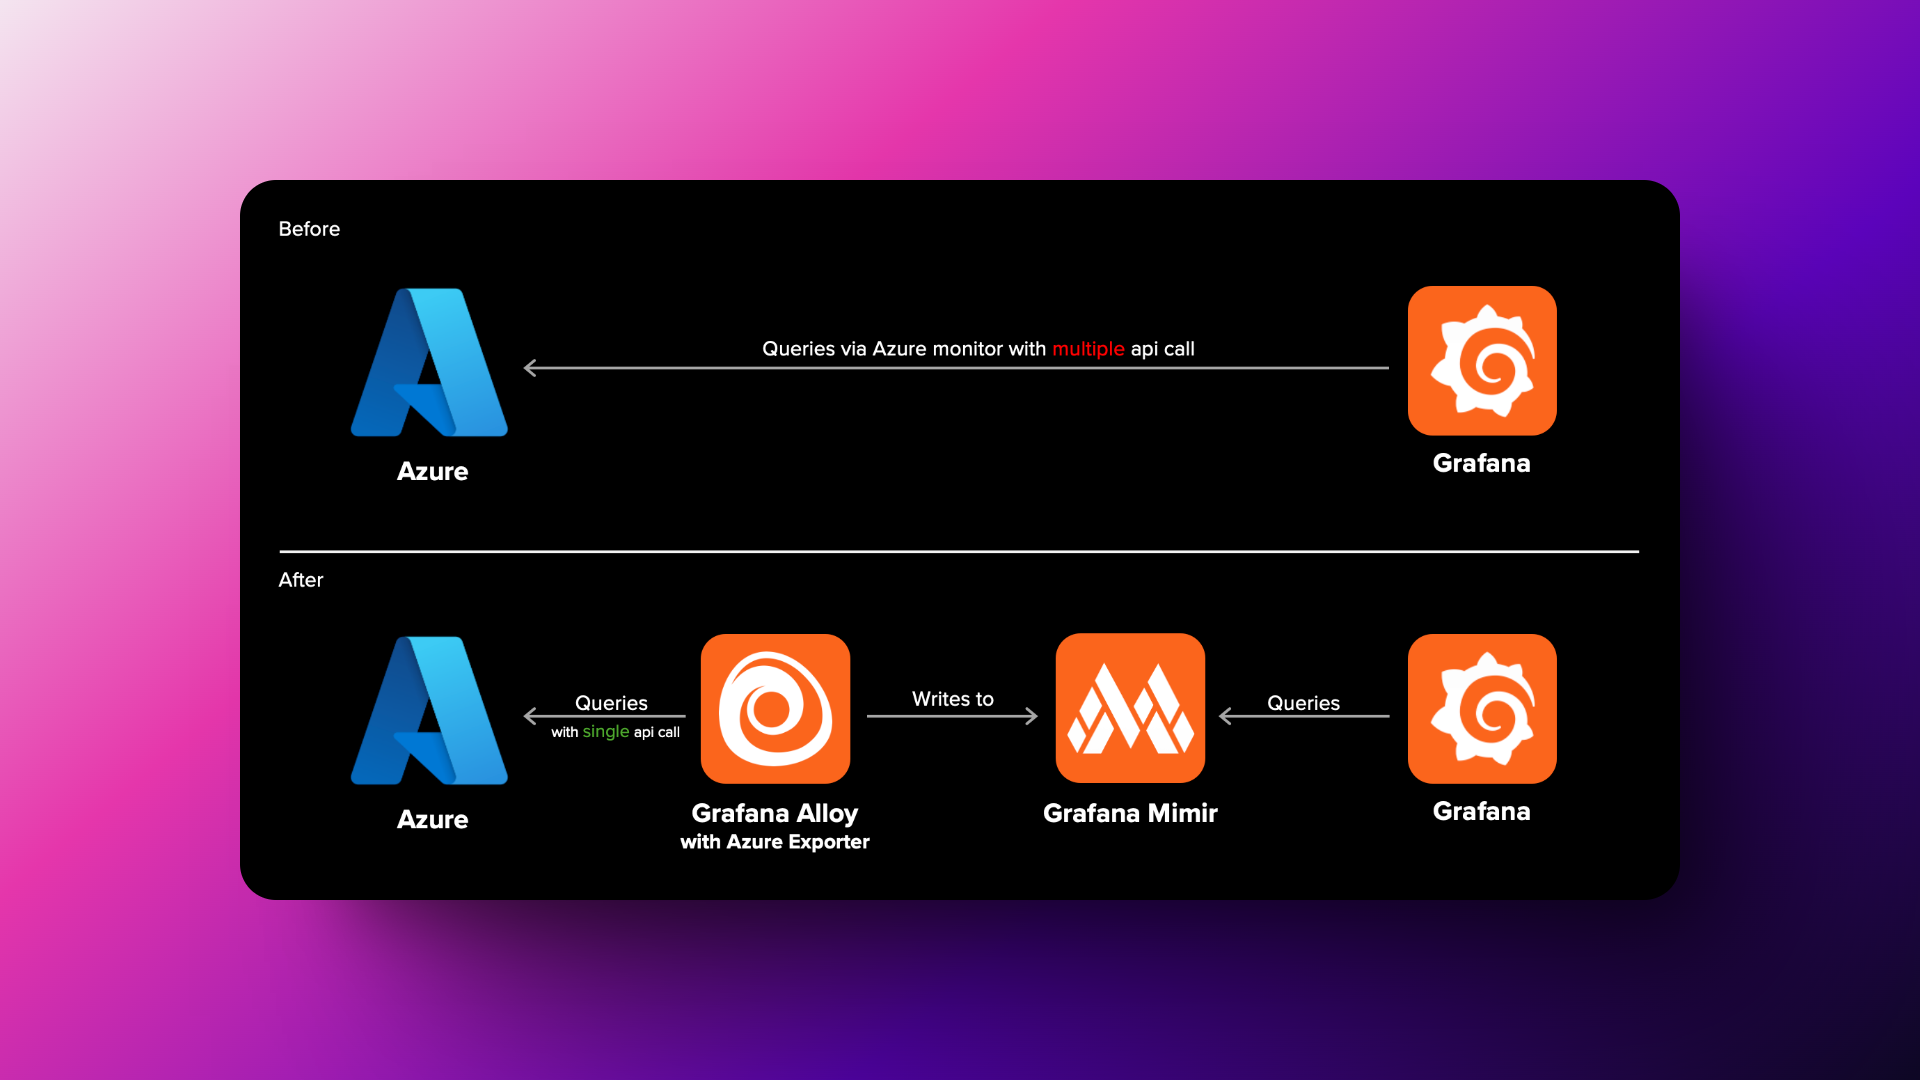
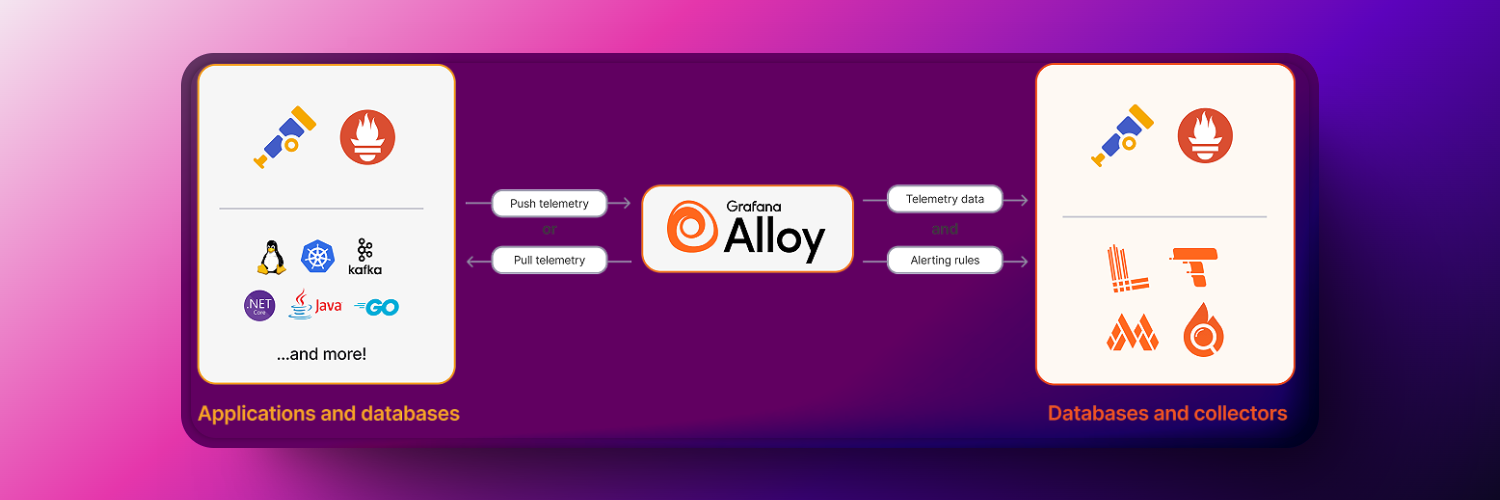
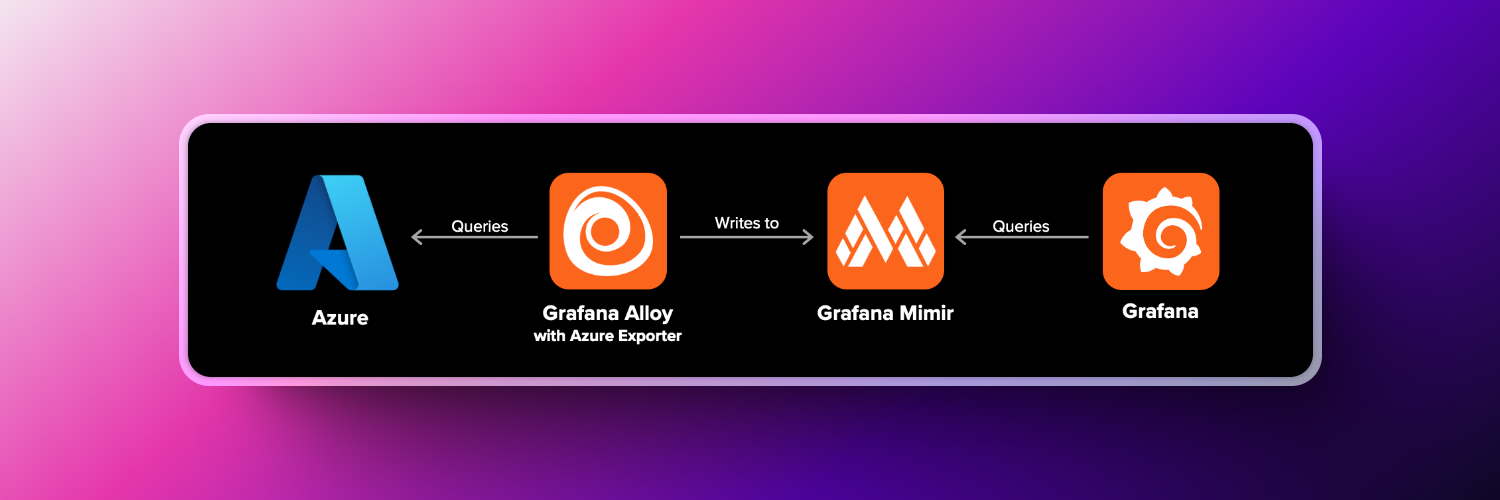
  1. Set up Grafana Alloy with Azure Exporter
    Deployed Grafana Alloy with Azure Exporter to pull metrics for all mysql instances
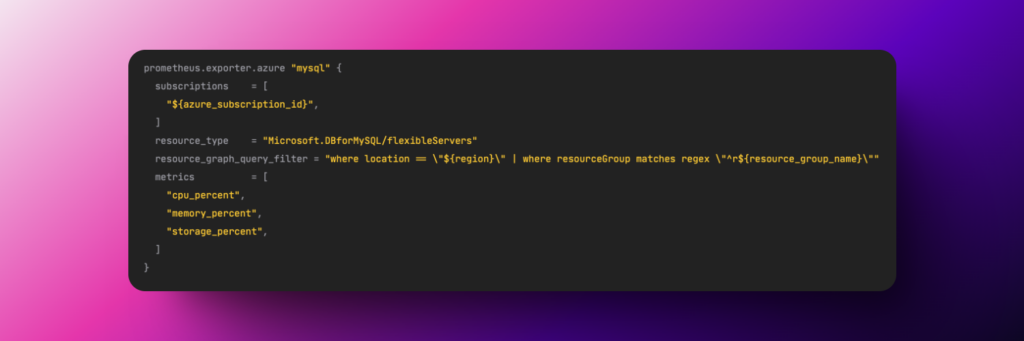
  2. Integrated with Grafana Mimir
    Directed all metrics from Alloy to Mimir for long-term storage
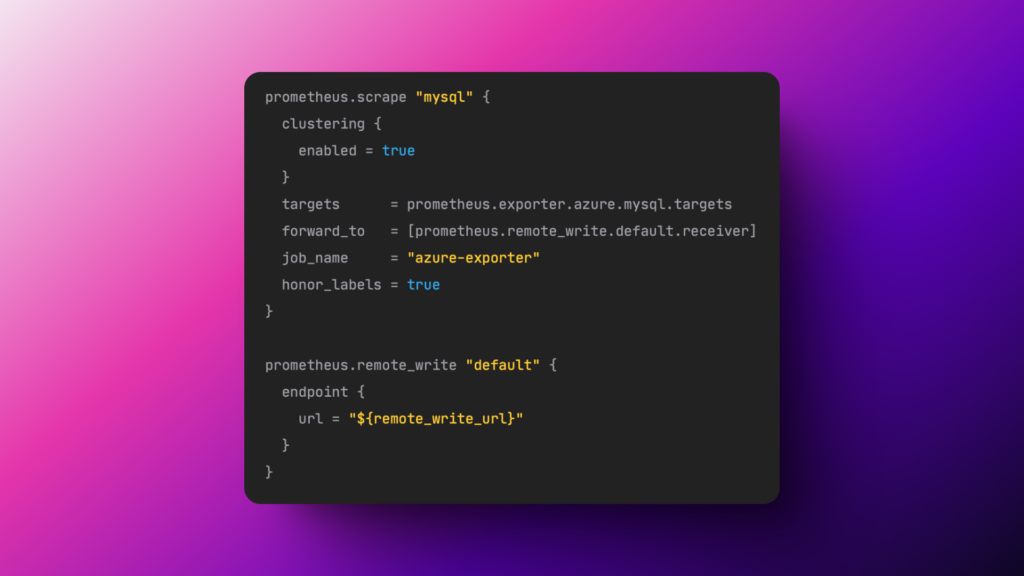
  3. Created New Alert Rules
    Built new alert definitions using Mimir as the data source. Leveraged regex patterns to create more efficient rules

    Example: One rule using mysql-.+ regex pattern can monitor memory usage across all instances


Results: A More Efficient Monitoring System

This architectural change produced several significant benefits:

Reduced API Calls – By centralizing data collection through Azure Exporter, we reduced our API calls to Azure by approximately 85%.

Simplified Alert Management – Instead of hundreds of individual alert rules, we now maintain a smaller set of regex-based rules

  • One rule for memory alerts across all instances
  • One rule for CPU alerts across all instances
    …and so on

Improved Scalability – Adding new mysql instances requires zero changes to our alerting configuration.

Enhanced Reliability – Eliminating rate limit issues has resulted in more consistent and reliable monitoring.

Better Performance – The entire alerting system now responds faster with lower latency.


Lessons Learned

Here’s what we discovered along the way that might save you some headaches:

Watch those API limits from day one – Azure doesn’t give you unlimited API calls, so design your monitoring with this constraint in mind from the start.

Grafana Alloy is your friend – Using it as a transformation layer between Azure and your alerts means you only hit the Azure API once and can then create multiple alerts from the collected data.

Regex patterns are powerful – One regex-based alert rule can replace dozens of individual rules. For example, our cpu_usage{resource=~"mysql-.+"} pattern monitors all MySQL instances with a single rule.


By making these changes, we went from constantly hitting API limits to having plenty of headroom, even as we continue to add more MySQL instances to our infrastructure.


If your organization is looking for a DevOps solution to automate processes, reduce costs, and drive sustainable growth, SCB TechX is here to help you achieve those goals.

Contact us at https://forms.office.com/r/P14E9tNGFD

Related Content

  • ทั้งหมด
  • Blogs
  • Insights
  • News
  • Uncategorized
  • Jobs
    •   Back
    • DevOps
    • User experience
    • Technology
    • Strategy
    • Product
    • Lifestyle
    • Data science
    • Careers
    •   Back
    • Partnership
    • Services & Products
    • Others
    • Events
    • PointX Products
    • Joint ventures
    • Leadership
    •   Back
    • Tech innovation
    • Finance
    • Blockchain

Your consent required

If you want to message us, please give your consent to SCB TechX to collect, use, and/or disclose your personal data.

| The withdrawal of consent

If you want to withdraw your consent to the collection, use, and/or disclosure of your personal data, please send us your request.

Vector

Message sent

We have receive your message and We will get back to you shortly.